It was a Saturday afternoon. Premier League fixtures were twenty minutes from kick-off. I was watching my IPTV panel dashboard like a hawk — green status lights across the board, stream health showing 98%, active connections ticking along beautifully. Then, within four minutes, my support inbox turned into a warzone. Buffering. Black screens. “Your service is rubbish.” The dashboard still showed green.
That’s the uncomfortable truth about most reseller panels in the UK market right now. The interface looks professional. The numbers seem healthy. But underneath, the load balancing logic is either misconfigured, delayed in its reporting cycle, or simply lying to you because the upstream provider hasn’t updated their status feed in three minutes. By the time your IPTV panel dashboard registers a spike, your customers have already started cancellations.
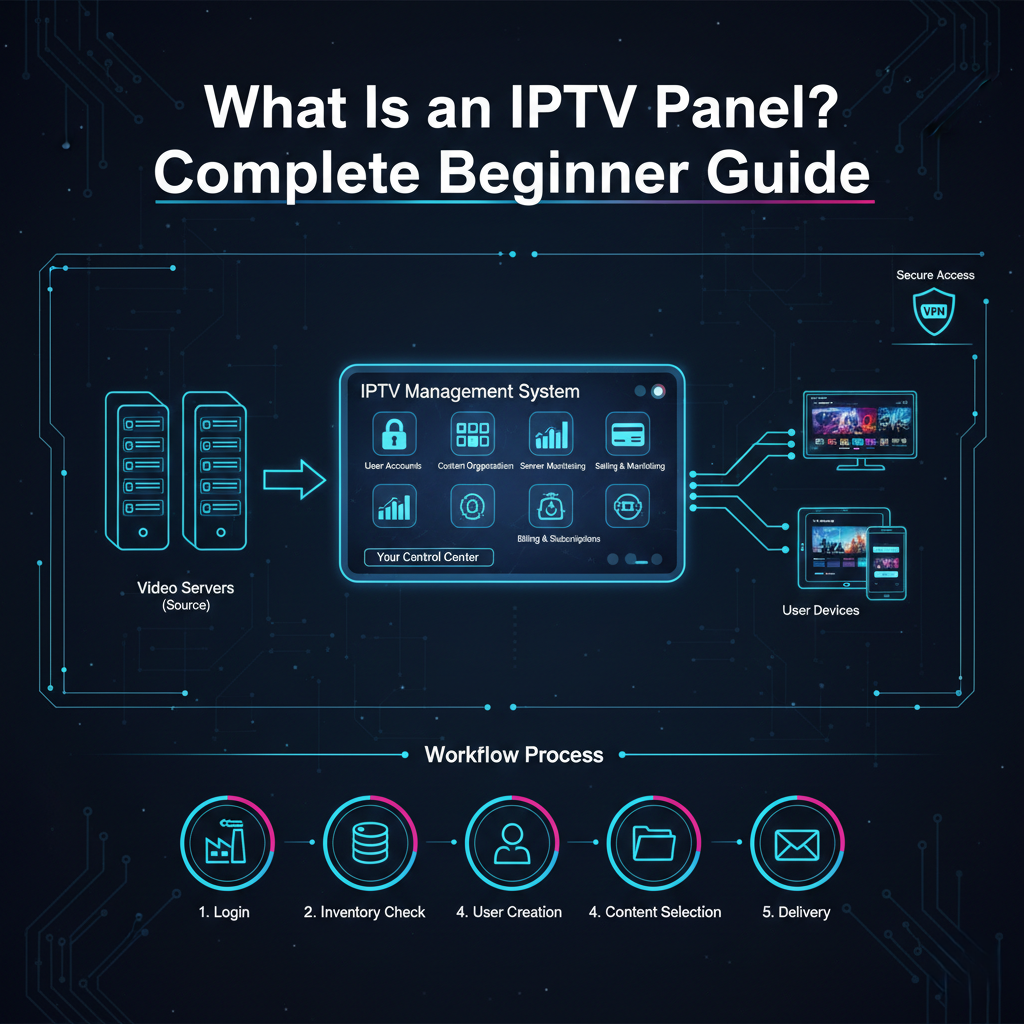
This piece IPTV Panel Dashboard is not about which panel looks nicest. It’s about understanding your dashboard as a diagnostic instrument — knowing what its metrics actually mean, what they obscure, and how to configure it so you’re never the last person to know your service has collapsed.
What Your IPTV Panel Dashboard Actually Measures — And What It Doesn’t
Every reseller I’ve spoken to over the years makes the same early mistake: they treat the active connections counter as a proxy for service health. It isn’t. Active connections tell you how many authenticated sessions are open — not whether those sessions are delivering clean, buffer-free streams to end devices.
A connection can remain “active” in your IPTV panel dashboard for several minutes after the underlying HLS stream has stalled. The session hasn’t timed out, the token is still valid, and the panel counts it as live. Meanwhile, your customer is staring at a spinning wheel. This discrepancy between connection status and actual stream delivery is one of the most misunderstood gaps in reseller infrastructure management.
Read More: IPTV Reseller Panels
What you actually want to monitor in real time:
- HLS segment delivery latency — if segments are arriving late at the CDN edge, buffering follows within seconds
- Concurrent connection ceiling utilisation — expressed as a percentage of your upstream line capacity, not just raw numbers
- Panel credit consumption velocity — sudden spikes indicate either a trial abuse wave or an authentication loop bug
- DNS resolution time per stream request — elevated DNS latency is often the first signal of ISP-level interference
Pro Tip: Configure your panel’s alert thresholds so that HLS latency breaches trigger a notification before the active connection count drops. That’s your early warning window — approximately 90 to 120 seconds before customers start complaining.
The Load Architecture Behind a Stable IPTV Panel Dashboard
Here’s where most budget-tier reseller setups fall apart structurally. They’re running a single upstream provider piped through a panel with no genuine load distribution logic — just a round-robin DNS entry and a prayer. When peak load arrives, typically between 1PM and 6PM on match days, the entire architecture funnels into one chokepoint.
A production-grade IPTV panel dashboard should be underpinned by at least two independent upstream paths, with automatic failover logic that triggers in under 15 seconds. That 15-second window matters because most IPTV player applications — whether TiviMate, IPTV Smarters Pro, or STBEmu — have a buffer stall timeout of around 20 to 30 seconds before they throw an error to the user. If your failover completes before the player times out, the subscriber never notices the switch.
Infrastructure comparison:
| Feature | Budget Panel Setup | Premium Panel (e.g. IPTV Reseller UK) |
|---|---|---|
| Upstream paths | Single provider | Dual/multi-path redundancy |
| Failover speed | Manual or 60s+ | Automated, sub-15 seconds |
| Dashboard refresh rate | 60–120 seconds | Near real-time (5–10s) |
| HLS latency monitoring | Absent | Built-in threshold alerts |
| 4K HEVC stream support | Unstable | Dedicated 10Gbps+ uplink |
| DNS poisoning resilience | None | Encrypted DNS routing |
The difference between these two columns isn’t luxury — it’s whether your business survives a contested fixture window or haemorrhages half its subscriber base in a single afternoon.
Credit Management Inside the IPTV Panel Dashboard — The Profit Lever Nobody Talks About
Resellers who treat the credits section of their IPTV panel dashboard purely as a billing counter are leaving serious margin on the table. Credits are not just an accounting mechanism — they’re your real-time map of customer behaviour, demand elasticity, and churn risk.
The formula that drives margin clarity is straightforward:
Net Margin per Credit=Retail Price per Line−Wholesale Credit CostAverage Lines per Customer×Retention Rate\text{Net Margin per Credit} = \frac{\text{Retail Price per Line} – \text{Wholesale Credit Cost}}{\text{Average Lines per Customer}} \times \text{Retention Rate}
Most resellers calculate margin at the point of sale and stop there. The retention rate multiplier is where the real number lives. A customer retained for 6 months at a 12% lower monthly price is worth considerably more than a short-cycle customer paying full rate who churns after 45 days. Your panel dashboard’s credit consumption data — when read properly — tells you which cohorts are renewing, which are going quiet before cancellation, and where your pricing model needs adjustment.
Set up weekly exports from your panel’s User Management tab. Segment by connection age, package tier, and last-active timestamp. The resellers scaling past 500 active lines in the UK market are almost always the ones treating this data as a retention instrument, not just an invoice generator.
AI-Driven ISP Blocking in 2026 — What Your Dashboard Won’t Tell You
The enforcement landscape shifted significantly through late 2025 and into 2026. Major UK ISPs are no longer relying solely on static IP blacklists or court-ordered domain blocks. The newer wave of interference is pattern-based — machine learning models analysing traffic signatures, connection frequency distributions, and stream request cadences to identify and throttle suspected IPTV traffic at the fibre aggregation layer.
This matters for your IPTV panel dashboard management because the symptoms are subtle. You won’t see a hard block. You’ll see elevated latency on specific ISP networks, slightly higher buffer events among a particular subset of your subscribers, and anomalous HLS segment delivery times that don’t correspond to any server-side load increase. The problem is upstream of your panel, and your panel has no native visibility into it.
What operators running IPTV Reseller UK infrastructure have found effective is cross-referencing panel-side latency data against known ISP FTTP aggregation windows. When latency spikes correlate with specific ISP throttling periods rather than your own server load peaks, you’re dealing with network-layer interference — and the response strategy is different from a server-side fix.
Pro Tip: Maintain a small internal test account on each major UK ISP network. Run parallel stream health checks during peak windows. If your panel shows healthy but ISP-specific test accounts show buffering, you have a network-layer problem — not a panel problem.
Scaling Your IPTV Panel Dashboard From 50 to 500 Lines Without Breaking Everything
Growth on a poorly architected IPTV panel doesn’t scale linearly — it breaks exponentially. The point of fracture for most UK resellers is somewhere between 150 and 250 concurrent connections, where the session management overhead on under-resourced upstream nodes starts to degrade response times across all active streams simultaneously.
The scaling approach that actually works:
- Segment your subscriber base by connection quality tolerance — 4K HEVC viewers need dedicated upstream allocation; SD viewers can share pooled capacity
- Implement connection limits per reseller sub-account before scaling, not after — retrofitting limits on live accounts causes immediate churn
- Use your panel’s stream statistics export weekly to identify the top 10% of bandwidth consumers — they’ll define your infrastructure ceiling before anyone else does
- Pre-provision credit pools 48 hours before major fixture windows — panels that run credit validation checks under load add 200–400ms latency per authentication request
- Review your panel’s EPG update schedule — large EPG payloads fetched during peak hours are a silent performance killer that appears as general sluggishness in your dashboard
IPTV Reseller UK is built to support this growth curve without requiring resellers to rebuild their panel configuration from scratch at each threshold. That’s not a small thing when you’re managing several hundred active subscribers and don’t have an infrastructure team behind you.
IPTV Reseller Success Checklist
- Configure HLS latency alerts in your panel — set a threshold of 800ms as your warning trigger, not your crisis trigger
- Audit your dashboard’s metric refresh rate — anything above 30 seconds is too slow for peak-hour management
- Cross-reference credit velocity data weekly to identify pre-churn patterns before subscribers cancel
- Run ISP-specific test accounts to distinguish panel-side from network-layer disruptions
- Pre-scale upstream capacity 24 hours before major fixture windows — reactive scaling during live events is always too late